Mapping Open Data With Open GIS
This post explores some cartographic features of QGIS while mapping the river network of Tirol, Austria. All data used is freely available.
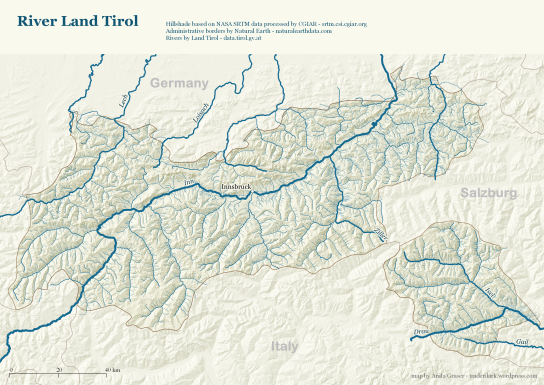
For the background, I downloaded NASA SRTM elevation data from CGIAR-CSI and created a hillshade using Terrain Analysis tools in QGIS 1.8.
To emphasize both state borders and the fact that Tirol consists of two separate areas, I created a mask using the Difference tool and styled it a transparent white.
The river network is too dense to label all rivers on an A4 map. Expression-based labels make it possible to only label selected features. For this dataset, the expression limits labeling to features with certain values of GEW_WRRL attribute:
CASE WHEN (GEW_WRRL = '10.000 km2 Fluss' OR "GEW_WRRL"= '4.000 km2 Fluss' OR "GEW_WRRL"='1.000 km2 Fluss') AND length("GEW_NAME_A") < 10 THEN "GEW_NAME_A" END
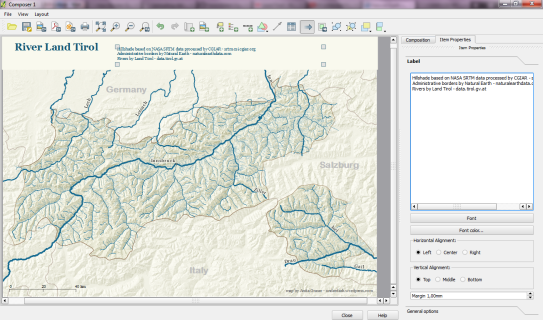
Labels of neighboring areas together with map title, descriptions and scale bar were added in Print Composer.
Working with Print Composer, it is useful to know that you can use Copy&Paste to duplicate map components and right-click to lock them from being moved. Also, every new component by default comes with a black outline and white background which can (and should) be disabled/changed in “General options”.
This is the final QGIS Print Composer output – without any further post-processing in Inkscape or Gimp:


Thanks for posting this useful example.
qGIS is very useful and powerful.
Very impressive example!
Interesting example, two questions though:
1) Why don’t you use the same colour for river names as for their streams?
2) Typing Italy and Salzburg might be misleading – administratively they are not the same units, shouldn’t they use different fonts?
And one more: 3) Do you think it would be possible to create a river stream which gains width along its way? I mean rivers are usually much narrower on their beginnings, then their width increases and the estuary should be the widest part, right?
Thanks for your feedback.
1) I had the impression that the river color was a little too light to be comfortably readable when viewing the whole page on (my 11′) screen.
2) You’re right, absolutely.
3) As far as I know, that would only be possible by splitting the features. Maybe it would also be possible to write a special river renderer.
That special river renderer might be really useful tool. Although how many parts would one need to create smooth river stream? It can get quite tricky I think.
Re point 3) River width is a function of depth of flow (m3/sec) which depends on the side slopes and the velocity of the flow at any specific point on the watercourse. Accordingly width of flow will vary continuously.
Nice post. I had one doubt though: what styling did you use for hillshade? A simple hill shade creation will give the output in grayscale.
I applied a simple two-color colormap from light yellow to a darker yellow/brown to the hillshade.
Pingback: Example of Mapping Open Data With Open GIS
Hello and thanks for these usefull explanations.
I would like to test it by myself but I can’t find the “terrain analysis” toolbox in my raster menu… though I have update my QGIS to the 1.8 version… did you need to install any complementary package ? (Using QGIS on a Linux-Mint OS, derived from Ubuntu)
It should be pre-installed but you might have to activate it in Plugin Manager.
found ! thank you !
hi,
first, I’m starting with QGIS and your posts are really usefull for me, so thanks ;)
I have some problem with SRTM data. I haven’t anz data in downloaded geotiff. There is only Band 1 instead of all three and there is not any data in attribute table, so I can’t create hillshade or anything else with SRTM data :( Do I need some plugin for SRTM? (I’m using QGIS 1.8 on W7)
Thanks, Dan
Your data is fine. SRTM rasters consist only of one band. In this band, every raster cell has a height value. Also, rasters don’t have attribute tables.
ok, I apologize :) Mistake was between my chair and keyboard :), almost everything is ok now ;)
Dan
No problem :) Best wishes, Anita