Group Stats tutorial
Group Stats is a plugin for QGIS which makes it easy to calculate statistics for feature groups in a vector layer. Note that the plugin is still marked “experimental” so you have to allow experimental plugins in order to install it. I tried this plugin for the first time today and decided to write this post because it didn’t seem immediately obvious how to use it.
The plugin button is added to the vector toolbar and of course you can access it via vector menu.
The example I want to show is: How to calculate the total area of each Corine Land Cover (CLC) class per state.
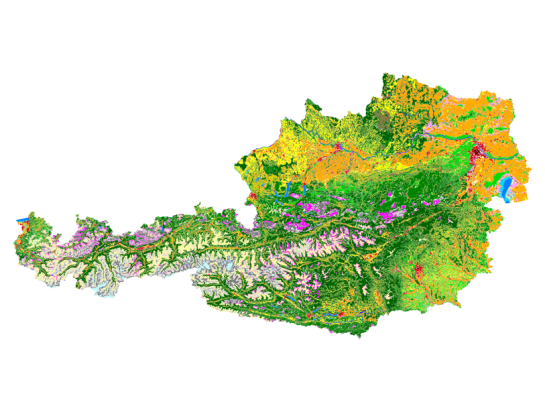
After adding state information to the CLC datasets by intersecting CLC and state geometries from Natural Earth we can get started with Group Stats.
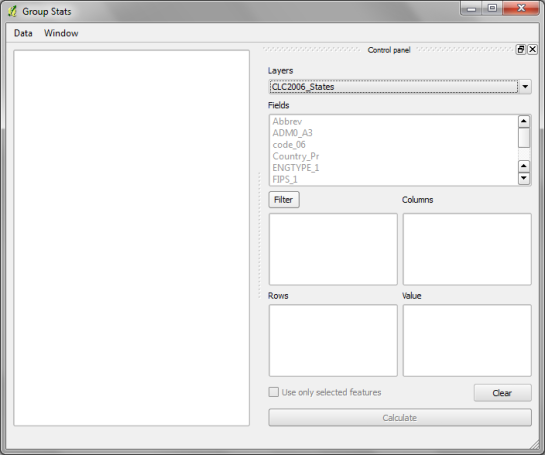
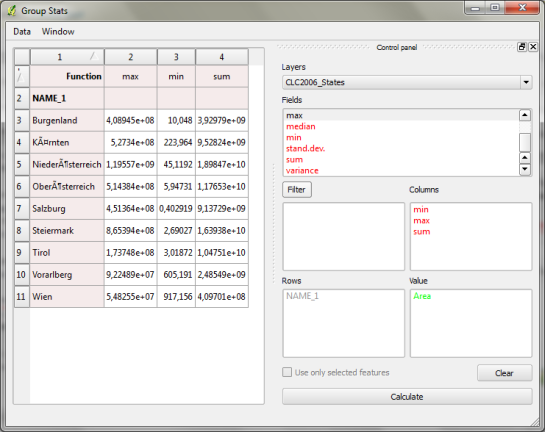
The big area on the left will display the results. The input fields are on the right. The general idea is to drag and drop fields and/or functions into the “columns”, “rows” and “values” sections. (Double-clicking field names does not do anything.) To remove fields again, you have to drop them back into the field list.
To calculate the total area of of each Corine Land Cover (CLC) class per state, I chose land cover classes as columns, state names as rows and sum of areas as values:
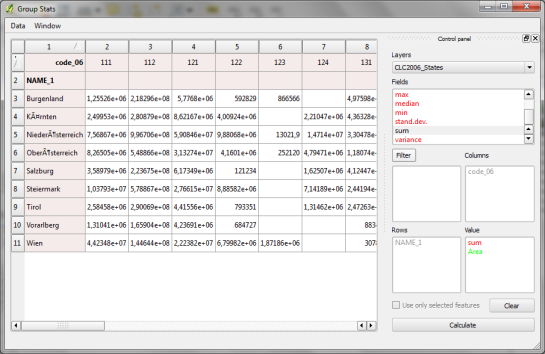
It’s also possible to add multiple functions in the columns/rows input sections to calculate different statistics at once:
Group Stats can be used in many cases that otherwise require a Spreadsheet software. The results can be exported to CSV easily. Usability could certainly be improved by allowing common interactions such as removing fields by pressing the delete key or adding fields by double-clicking.

Thanks for this tutorial. I was planning to try out this plugin for some time now, but hadn’t come around to do it yet. But with this implementation of a pivot (cross table), it actually looks very promising, offering similar (to some extent) functions as the pivot table function in Excel or LO Calc. Nice!
Right, it’s like pivot tables. I wasn’t sure how well-known the term is. It seems to depend a lot on the background a person has. Pivot tables seem to be very popular with people with economics background as far as my experience goes.
I think it has rather to do with familiarity with excel or Libre- or OpenOffice (but OO used to call it data pilot in earlier versions).
Could I translate your tutorial in french ?
Sure, feel free.
Finaly our staff do it and well with some adaptation on http://portailsig.org/content/plugin-qgis-group-stats.
I spend much time on QGIS Server to deliver french tuto also
Could I add link to your tutorial in plugin GroupStats?
Sure, go ahead.
Thanks. Link added in version 1.9.7
A very nice feature. But be aware, that it acts on your whole layer even if you think you have sorted part of it out in a query (by right clicking in the legend an choosing Query). I don’t know if this is intentional? I think taht most other plugins only work on your queried data?
This bug has been removed in version 1.9.90
Thanks, for the tutorial. It is almost excatly what I was trying to do. But to my shame I fail already on the second step: How do I “intersect” the to layers. I always get one layer with the wohle CORINE data on top an the 9 Bundesländer at the end. (Vektor-> Geoverarbeitungswerkzeuge-> Vereinigungen)
Any suggestions, thanks a lot!
Intersection could be called “Verschneidung”.
Thanks, but where can I find this command in qgis. Sorry total beginner in GIS-stuff….
Ok, “Intersect” is called ” Schnittmengen” in the German version (also in Geoverarbeitungswerkzeuge).
Thanks a lot. But I alwasy get an empty attribute table. Hmm, maybe try something different….
Both layers have to be in the same CRS. On-the-fly reprojection is NOT enough,
Thanks for the nice tool. But I have the following problem, when selecting a row displays the following error:
. qgis / / python / plugins / GroupStats / GroupStatsDialog.py “, line 94, in sortRows
self.ui.wyniki.model (). sortRows (wiersz, Tryb)
. qgis / / python / plugins / GroupStats / GroupStatsDialog.py “, line 926, in sortRows
self.kolumny.append (kolumny2 [i [0] +1])
Python Version: 2.7.3
QGIS version: 1.8.0-Lisbon Lisbon
The option to select the row, leads me to zoom in on choices?
from already thank you.
Sounds like a bug. Please report it at http://hub.qgis.org/projects/group-stats/issues.
I couldn’t seem to get this to work on a CSV layer. Does it work for you or am I doing something wrong?
The “calculate” button is grayed out.
thanks for help, ido it!!!!
Can I save the configuration in control panel.
Thank
Not as far as I know.